People ask me all the time, “What does your normal day entail?” It is sort of a large question and changes from day to day. Therefore, I thought I would write a description of how I manage projects. Project management in the life sciences (and many research projects) consists of four parts:
1. Project management (ie. grants, budget, regulatory submissions, project outlines…)
2. Data acquisition (molecular diagnostics, tests, ELISAs, microscopy…)
3. Data analysis (statistics, graphic analysis, image analysis…)
3. Documentation (recording, presentation, publications…)
To give the reader a clearer idea of each aspect, I will provide a more detailed description of each. You can skip to any section of interest to you.
Project Outlines
One of my favorite tasks is producing project outline documents, lists and project reports. Continuous project outline facilitates the understanding of what has been done?, what needs to be done?, and whether something should still be done?. Most projects stem from a grant proposal, for me over the years ie coronavirus replication, control of endocytosis of receptors by src kinases, and entry of herpes viruses through receptors. The faculty splits the grant into between the staff into individual projects. These projects often consist of direct tasks outlined in grant (low risk) and exploratory projects (high risk) for new grants. Technicians are often assigned direct tasks outlined by grant and students and post-docs are assigned exploratory projects. Projects are completely unrelated and often difficult to understand without cohesive documents.
Project outlining is also one of the most powerful tools in communicating with managers and faculty. You always want to convey what is being done to avoid doing work outside scope of project and inline with management goals. While meeting and speaking with people regularly is important, most meetings are infective without documents and presentations. People tend to either be distracted or not listening. I am often not surprised if it takes a month or two for a concept to sink in with manager, repetition is the key. They often need a document to refer to continually to understand your progress and goals. I tend to make word document lists to enter a meeting and reports to support the meeting. These lists contain what I have done and what I am going to do and why. The reports are often drafts of papers and data I continually send. These reports become important in the cohesion of the project over time. It is really easy to get confused about something done a month ago, when it stretches out to years, without reports it becomes difficult to understand current status of the project. Again data and visuals are key here, graphs and pictures are important. 9 times out of 10, most people will only look at the chart and avoid reading text. Including well labeled compelling data charts is critical. Rule of thumb, all projects should be built on greater then two fold changes. Changes of less then two fold often lie within standard deviation and will not convince reviewers of project importance.
Grants
The most important part of getting a research project off the ground is funding. University research hinges on external funding from the National Institute of Health (NIH), non-for profit organizations, and corporate sponsored grants for research projects. What most people do not know is that most universities and hospitals do not fund their own research projects, they actually only provide the support staff and facilities for research projects. Depending on the hiring situation, universities will sometimes provide start-up packages; the majority of the focus is obtaining funding before hiring. After the investigator obtains funding, the university or hospital takes an overhead cut (generally 20-30% of the grant) and provides facilities for the research. Think of the university as more of the landlord and the investigator as the tenant. There are two main general categories of grants: NIH and non-for profit organizations (American Heart Association, American Cancer Society, Micheal J Fox Foundation and American Diabetes Association). In addition, companies have taken a growing interest in supporting academic research projects and universities interested in collaborating with pharmaceutical companies.
What is a grant? I will go over the general outline of a research proposal for the NIH. There are a variety of formats including fellowships, R01 (individual investigator’s lab), and project grants (multiple labs). All grants are submitted through the university through a principle investigator. Students, post-docs, and other personnel can only submit fellowships. Large grants (R01 and project grants) can only be submitted by university faculty.
Most of my experience is in the submission of fellowships and preparation of R01s to be submitted on behalf of principle investigators. NIH grants follow the general format of proposal, regulatory documentation (animal protocols, novel dangerous agents), supporting documents (letters, career development, feasibility statements) and budget. The proposals have a strict page limits and contain the outline of the propose project. Most proposals start with a concise one page explanation of 2-3 specific aims, why the project is important?, what you intend to do step by step?, and impact of the findings. The next section is the background. These sections describe the field to date and disease association. I have written background sections on a variety of subjects, including virology, immunology, heart disease, and diabetes/glucose metabolism. These sections usually detail the prevalence of the disease in the population, the impact of disease, potential methods of treatment, and molecular mechanisms. Diagrams in this section are often helpful. The next section is the preliminary results. The rule of thumb for most research grants is that 2/3 of the research must be completed to compete for large grant funding while preliminary data for fellowships are more flexible. The preliminary data section contains graphs, charts, and images data. I generally try to keep the data very visual and compelling to the reader. People tend to like to look at pictures and skip over supporting text. Small changes in data causes the reviewer to immediately shut down and dismiss the proposal. The next section is the details of the proposed project’s specific aims. Each specific aim is prefaced with a rational, description of data acquisition technique, and potential caveats to proposed data. The end of the proposal is wrapped up in a short conclusion. Usually a proposed model diagram is included about what I think is going on. Other support documents for the proposal include letters and statements of support. Letters usually come from collaborators and mentors. They describe why they think you are the perfect person for the project and you have access to all materials, competent in all techniques and can outsource unknown aspects to competent people. These support documents can often be as important as the proposal, depending on who the reviewer ends up being. Letters and support documents from high tiered professionals go a long way to funding a proposal. Associated with most proposals are regulatory documents concerning the animals and dangerous agents. These sections are often reviewed by the universities Office of Sponsored Research for potential dangers to university interests. Animal studies require detailed explanations of the necessity of the use of animals, details of treatment of animals, and minimal number of animals needed. This section has become more intense of the last decade and often the only section without page limits. Dangerous agents and controlled agents need to be outlined. This section usually protects against the generation of novel pathogens and poisons. Viruses and bacteria can only generally be made to be attenuated or made to not propagate (only one round of cell infection). If the proposal suggests working with a controlled agent, the university must have the correct biosafety facilities. If the proposal suggests making a potentially more pathogenic strain, it will not get funded. Universities in China halted research of SARS-CoV after the release of a laboratory strain of virus. Most universities will not risk being associated with a new infectious agent. The last section to discuss is budget. The budget section details number of personal, time devoted to project, and material costs. The bulk of the budget is the personal. Choice and number of personal is important. In terms of cost, students and post-graduates are cheaper then staff personal. They have unrestricted work hours and universities have guidelines on limiting salaries and time at university. Permanent research staff tends to be more expensive because they may be employed be university for several years and more costly. They also have strict hour regulations. Both have strength and weakness towards a project. Permanent research staff while more expensive are familiar with particular research lab because of experience. Students and post docs are cheaper but are often short term and slow to train in labs without strong training environments.
This sums up the details of NIH proposals I have worked on. After generating pdfs of the supporting documents, the proposal is submitted by the due dates. The NIH has specific due dates for proposals, usually 2-3 times a year. Most non-profits also have similar due dates for proposals. The proposal is submitted to the university office of sponsored research and electronically submitted to the NIH. Once at the NIH, the proposal is assigned a study section within one of the NIH’s several institutes (NIAID, NCI, etc) and reviewed. The reviewers consists of a panel of faculty members from across the united states, usually people familiar with the field in the proposal. The proposal will be scored and funded based off the score. If the proposal is not funded, the study section may provide comments on what they would like addressed in the proposal. Upon receipt of these comments, I usually address them in order and reply with a report or new proposal addressing the individual comments. While grant proposals can be well written and interesting, they still might not get funded. The NIH has specific areas of interest and exercises right to deny proposals based of being outside those interests.
Regulatory Submissions and Training
This aspect is were the explosion in time requirement and complexity has occurred over the last 15 years. Universities and staff devote a lot more time and training to this now then ever before. This includes biohazardous waste management, chemical waste disposal, infectious material containment, radiation safety, biohazard identification documents, animal regulations, and human sample regulation. I have dealt with most aspects of laboratory regulation, training and documentation. I have undergone extensive training in biohazardous waste disposals including classification of what is waste, proper containment and disposal. Most laboratories such as Northwestern University now document all biohazardous materials created. I have written detailed descriptions of the biohazardous waste: viruses generated, cell lines used, animal products (serum, blood…), and DNA constructs. I have been trained in chemical disposal and containment. Including acid and base separation, labeling caustic and cancer causing chemicals, no disposal of controlled chemicals down sinks, appropriate containers for caustic chemicals, labeling of containers, and keeping chemicals separate for disposal (combining chemicals lead to more difficult waste processing). I have been trained in radiation safety, and luckily the use of radiation has decreased over the years due to alternative techniques. I have also been trained in containment of infectious materials, these include use of biohazardous containment hoods and aseptic techniques.
Financing and Budget
One of the most under appreciated roles of university researcher staff, is their role in budget and cost management. Again, university laboratories actually run more like a small independent business leasing a space from a university. The university has little to no role in cost management of the laboratory but more overall maintenance of the facilities and staff payroll. A large segment of my time is calculating cost. Most universities laboratories run on the tournament model, meaning you hire a large staff and put them on different high risk projects. Depending on the success of the project, you run with one and dump all the other projects. A large staff and multiple projects means little left for supplies and tight budgets. Most laboratory budgets can range from 1,000-5,000 dollars per month, depending on size and animal costs (animal research is one of the most expensive aspects of research, you can quickly blow through a budget). Most of my responsibilities revolve around knowing the budget, keeping spreadsheets, prediction of experimental cost, supply chain understanding(brand cost, shipping costs…), and cost analysis. For myself and most researchers, we count the pennies as they come out of the pipette. If you blow through your months budget, you can not buy reagents potentially necessary for the month and ruin or slow down a project. For most of my managers, when in a meeting and proposing a potential project they will ask about cost and they will want numbers on potential cost right then. They will also want a potential understanding of the return on investment and if the project can be completed.
My PhD was in the application of molecular biology techniques applied to virology and cell biology. Molecular biology is the basis of the majority biomedical diagnostics. I have experience in the application of these techniques to projects in virology, cancer biology, and glucose metabolism. In this section, I have partitioned the techniques based of the type of data produced and root of methodology ie RNA/DNA, protein, functional and imaging. This list is by no means comprehensive and include all my experiences, rather it serves as reference for my knowledge base. A pdf list of my skills can also be found here for printing: List of molecular biology skills
DNA/RNA analysis
My experience in DNA analysis include plasmid cloning, DNA sequencing, RT-PCR, Northern blotting, real-and time PCR.
Methods in nucleic acid are split into two categories: DNA and RNA. They further are subdivided into manipulation and quantitation. DNA manipulation includes cloning, mutagenesis, and DNA sequencing. I have experience in restriction enzyme digestion method of cloning. I have cloned several viral genes including segments of coronaviruses, herpes viruses, and cellular proteins. The genes were placed in vectors for both mammalian and bacterial expression. In addition, I have mutenagenized these genes using PCR site directed mutagenesis. I have introduced deletions and point mutagenesis in critical areas of the gene including catalytic sites and protein binding sites. I checked for the confirmation of these mutations by DNA sequencing. I have also used DNA sequencing to examine the coding regions of genes from viruses and cellular genes after PCR amplification.
DNA and RNA quantitation is done through two primary methods: PCR amplification and hybridization. I have quantitated cellular and viral genes through RT-PCR and quantitative RT-PCR (both primer probe and syber green methods). For RNA, the RNA is harvested from tissue or cell culture and isolated. The isolated RNA is subjected to a reverse transcription reaction to transform the RNA into DNA. After reverse transcription, the DNA template is amplified over a number temperature cycles. At each cycle fluorescence is measured. The intensity of fluorescence is plotted and level of transcript determined relative to a standard. I have used this technique in a variety of projects. It is useful in measuring the replication of viruses and determining the rate of viral replication. In addition, the technique is useful in measuring the induction of genes, such as stress genes and interferon inducible genes. I have used this technique to monitor gene induction after treatment of cells with drugs and cytokines, to measure the induction of specific genes.
Protein analysis
My experience in protein analysis includes western blotting, ELISA, flow cytometry and immunoprecipitation. These techniques provide with a variety of information about the biochemical properties, interactions, and concentrations of proteins. My experience in western blotting includes the detection of viral proteins, stress proteins, transcription factors and proteins involved in cytoskeletal rearrangement and cancer development. These proteins are isolated from tissue or cell culture and mixed with protease inhibitors to maintain the stability of the protein. Western blotting involves the electrophoretic separation of proteins based off size and transfer to a solid nitrocellulose support. Once on the support, it can be probed with a variety of antibodies to give information on phosphorylation, location, and variant of protein. While western blotting provides relative quantitation of a protein, without a known standard exact concentration cannot be determined. Western blotting can be mixed with another technique immunoprecipitation to provide information on protein-protein interactions.
ELISA is a useful technique in measuring exact concentration of a protein or protein secreted by a cell. Since ELISAS use a standard, they provide exact concentrations of cytokines and secreted proteins. I have preformed ELISAS for the detection of TNFa, IFNg, IL-6 and a variety of secreted cytokines. Depending on the concentration and increases in these cytokines, I can determine if inflammation is occurring.
FLOW cytometry provides information on protein expression on a per cell bases. I have isolated cells from tissue (spleen and brain) and cell culture. The cells were incubated with specific antibodies to provide information such as inflammation state, cell type, and infection status. Flow cytometry is an interesting technique because it provides a wide variety of information including infiltration of inflammatory cells into infected areas, number cells infected, and expression of a particular protein in a cell type.
Functional assays
Functional assays analyze the different activities of a cell such as endocytosis of solutes, migration of cell, and amount of virus in a solution. For discussion’s sake, Endocytosis is partitioned into three main types: clathrin/caveolin endocytosis, phagocytosis, and fluid phase endocytosis. Most cell types normally utilize clathrin/caveolin endocytosis for the endocytosis of a receptor after ligand interaction. After endocytosis, the receptor/ligand complex disassociates leading to either recycling or degradation of the receptor. I have measured the endocytosis of the antigen/antibody complex by macrophages utlizing fluorescently labeled antigens. Phagocytosis is primarly utilized by macrophages for the uptake of large solid antigens (bacteria) and removal of particulate debris (bone, metals, lipid particle)s. The phagocytosis of the particulate requires large cytoskeletal rearrangements, and anchoring of the cell to the particulate through a receptor/ligand interaction. I have measured macrophage phagocytosis of opsinized red blood cells and beads. These assays use either colormetric or fluorescence for quantitation. The last form of endocytosis I have measured is fluid phase endocytosis. Fluid phase endocytosis occurs when large segments of plasma membrane involute and dragging cytosolic contents into the cell. I have measured fluid phase endocytosis of chemicals (fluorescent dextrans, lucifer yellow) and fluorescent ovalbumin.
Imaging
Images provide detailed information on how cells respond to stimulation, cell type, and movement.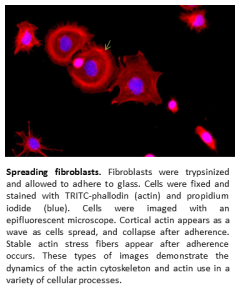 I have used light microscopy, fluorescent microscopy (epifluorescent and confocal), and electron microscopy in several projects depending on the situation. Most of experience with light microscopy is for the identification of the outline of cells. Using different filters, I can image cells and determine there border and shapes. I often use this technique in parellel with fluorescence microscopy. Fluorescent microscopy utilizes a fluorescent tag to image proteins in a cell. The fluorescent tag is excited with one length of light and a filter catches the excitation of the fluorescent tag in another wavelength. The fluorescence can be captured in all plans of the cell (epifluorescent) or in one single plan (confocal microscopy). I have monitored the location of inflammatory cells infiltrating infected tissues, the cytoskeletal rearrangements of cells during adhesion and migration, and subcellular localization of proteins. The final method of microscopy I have used is electron microscopy. This method exams cells at a nm scale in detail. I have used this technique to exam detailed organelle rearrangement during viral infection and stress responses. In these instances, membranes were rearranged within the cell and the details of the rearrangement required electron microscopy to examine.
After the acquisition of data, the data is analyzed and trials compiled. The vast majority of the data is quantitative and requires statistical analysis for significance. Image data produces qualitative data which must often be translated to quantitative data. Depending on the data type, I also choose the appropriate graphical representation to aide in analysis.
Bar graph and line graphs
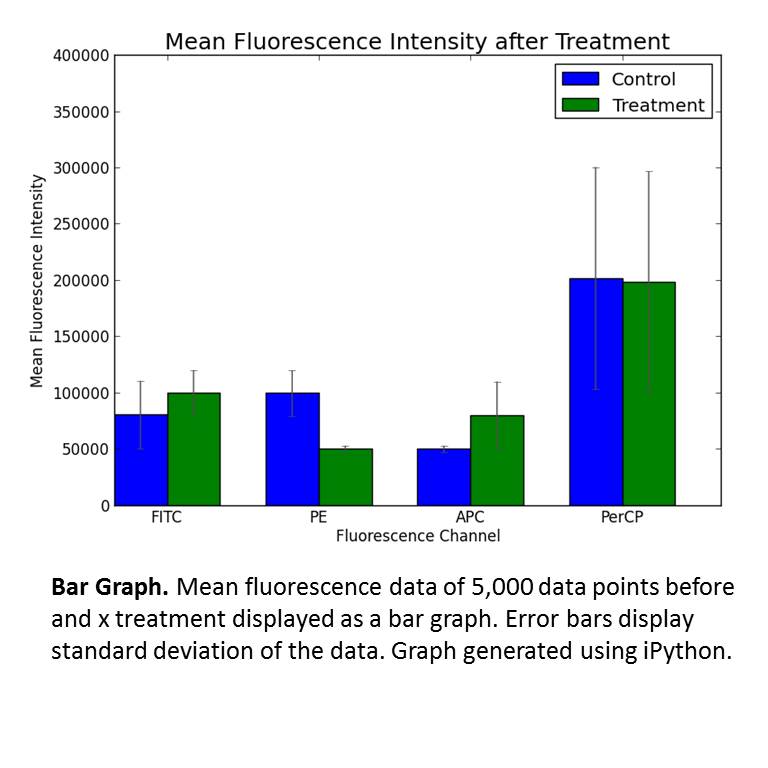
The vast majority of data translates well to bar graphs (single time point) and line graphs (over time). The bar for conclusions on data requires three independent trials. These trials are preformed on separate days to avoid inclusion of artifacts into the data. The data is averaged and combined. Since a variety of techniques provide arbitrary units and detector sensitivity changes from day to day, data produced on different days has to be standardized and set to a scale (percentage or over standard that does not change). To determine significance, I derive the standard deviation for the data. I choose standard deviation over standard error because of the stringency. Standard deviation is also the root of t-test and significance calculations.
linear/logistic regression
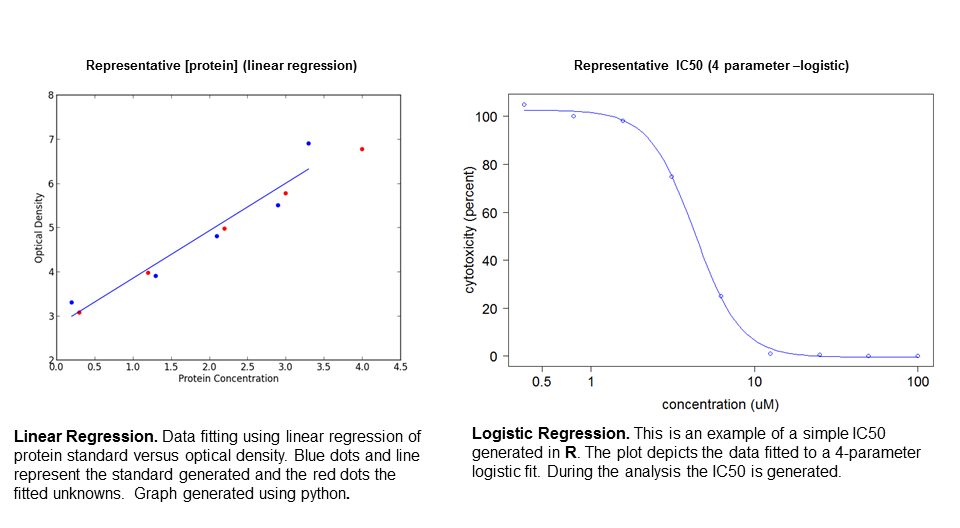
Molecular biology techniques utilize different standard curves to calculate absolute quantities of unknowns. To generate the scale, I utilize linear and logistic regression depending on the data. Some data require 4-parameter logistic fits for analysis (ELISA and IC50) (R code here 4 para-logit), and other data requires a linear fit (protein concentration determination). Linear regression utilizes the use of least squares to find a line that would best fit standards data points. After the line has been fitted, the equation can be solved and unknowns can be plugged into the equation.
Scatter/plots and histograms
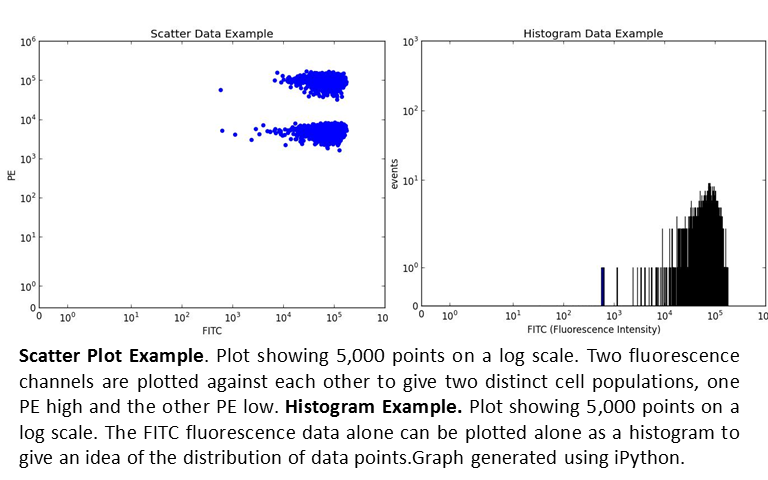
Scatter plots and histograms are useful in the interpretation of flow cytometry data. Flow cytometry produces massive data files contain thousands of data points. The identification of a specific cell type is done by associating multiple fluorescence channels with each individual cell. I identify the quantity and other characteristics of the cell type by plotting various fluorescence channels on each axis. Depending on the fluorescence channel, the cell types will form clusters that allow me to identify the cell type. To further analysis the groups, I often use histograms. Histograms provide information about the mean, geometric mean (if not a normal distribution) and standard deviation.
DNA analysis/Pattern Recognition
One of the more unusual tasks I preform is examining and searching for patterns of letters in text. This is because biological data is consists of large strings of letters. Either the simple ACGT(ACGU) code of DNA/RNA or the larger multi-letter code of protein. I will often have to search these files for patterns (motifs). These patterns will either be exact matches of fuzzy versions of the pattern. My job is to go through the data files and find examples of these patterns or derivatives of these patterns. I will often have to compile lists and locations of these patterns or develop methods for search for frequency of these patterns.
Relationship maps/networks
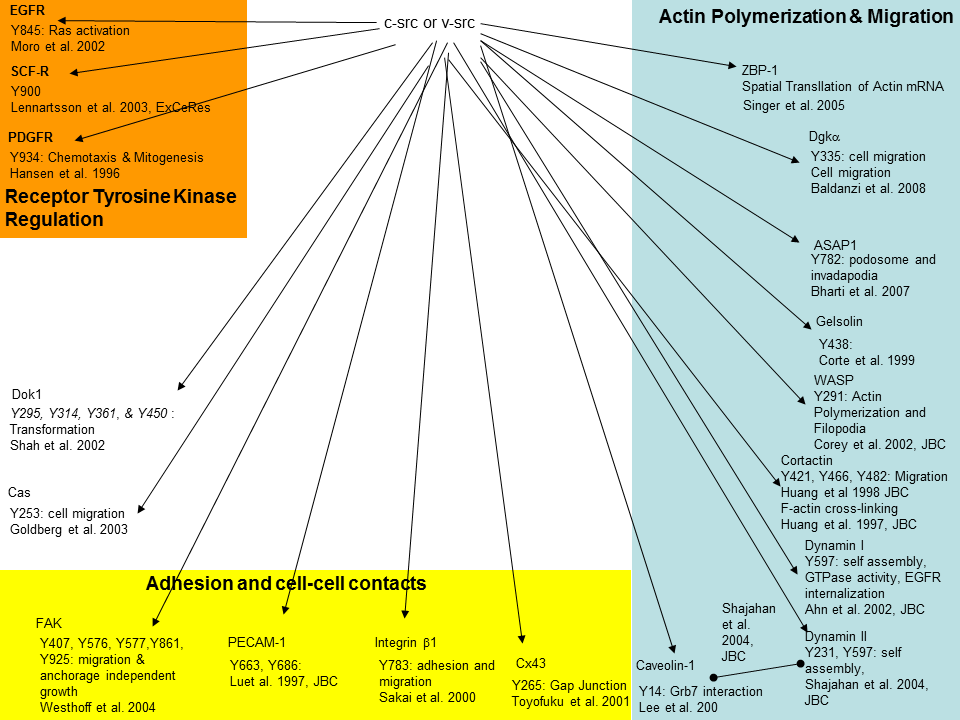 I spend an enormous amount of time just sifting through journal articles and project reports. Usually only one report of an instance is produced per lab. Since there are so few studies on a topic out of one lab, I have a hard time determining the strength of the report and the direction I should take with my study. I find an effective tool for visualizing relationships is relationship diagrams. Relationship diagrams take a specific occurrence, for example Src phosphorylation targets, and provides a graphical representation of the number of events (instances of Src phosphorylation). Once I have found the number of events, I can group them together by function (proliferation, migration, etc). By doing this, I know created a framework of support for my hypothesis. Instead of pursuing projects with only one documented instance, I pursue projects with several related instances (ie src phosphorylates targets involved in migration).
Notebook/Records
Probably one of the most time consuming aspects of research and critical is producing written documentation of research results. Most research projects spread over 2-3 years, and finding a particular experiment preformed in the beginning provides a challenge. The diversity in data types provides a challenge to organize also, cluster analysis, graphs, and image data. I usually choose to organize my data in Microsoft Word and embed data directly into the document (images, excel sheets, graphs). The preface to the notebook contains the index. The index contains the dates, short experiment descriptions, and trial number. Individual experiments are recorded with rational, methods, and results. Excel sheets contain the original data and trials are compiled and results combined. Progress charts help with remembering of trial number and dates during the process.
Publications
Several of my studies have been published in academic journals and I have been involved in all stages of preparation for submission and publication. Most science journals select specific topics they publish on, virology, immunology, cancer biology. Articles touching multiple aspects and I select journals with appropriate previous content in those fields. In addition, specific editors and reviewers have to be chosen. These reviewers have experience in the specific topic. Submission requires proper formatting of the document for the journal and the formatting figures at the correct resolution. Following submission, there is a few month lag before receiving reviewers comments. Then I address the comments and reformat the document for re-submission. If a the article is accepted, the document has to go through final formatting and I work with editors to address journal specific style issues. At that point, I receive the final mark-up and okay the final submission.
Pichot PS, Hartig, SM, Arvanitis C, Jensen SA, Bechill J, Marzouk S,Yu J,Frost JA,Corey SJ. 2010. Cdc42 Interacting Protein 4 promotes breast cancer cell invasion and formation of invadopodia through activation of N-WASp. Canc Res.
Y. Feng, SM. Hartig, J. Bechill, EG. Blanchard, E. Caudell, and SJ. Corey. 2010. The Cdc42 Interacting Protein 4 (CIP4) Gene Knockout Mouse Reveals Delayed and Decreased Endocytosis. J Biol Chem, 285: 4348–4354.
Bechill, J., Z. Chen, JW. Brewer, and SC. Baker. 2008. Coronavirus infection modulates the unfolded protein response and mediates sustained translational repression. J. Virol. 82: 4492-4501.
Bechill, J., Z. Chen, JW. Brewer, and SC. Baker. 2006. Mouse hepatitis virus infection activates the IRE1/XBP1 pathway of the unfolded protein response. Adv. Exp. Med. Biol. 581:139-44.
Harcourt, BH., D. Juckneliene, A. Kanjanahaluethai, J. Bechill, KM. Severson, C. Smith, P. Rota, and SC. Baker. 2004. Identification of severe acute respiratory syndrome coronavirus replicase products and characterization of papain-like protease activity. J. Virol. 78:13600-612.
Conferences
Another important way to disseminate research findings is through attending conferences. Conferences provide an excellent forum for presenting research and getting feedback from peers at different institutions. I have attended and presented at a wide variety of conferences including American Society for Virology, International Nidovirus Symposium, International Symposium on Positive Strand Viruses American Society for Cell Biology, and International Herpes Virus Workshop. I presented both oral presentations and poster presentations of my work and answered questions on my projects
- 2004 23rd Annual Meeting of the American Society for Virology(Quebec, Canada)-attended
- 2005 Xth International Nidovirus Symposium (Colorado Springs, CO)-presentation
- 2006 25th Annual Meeting of the American Society for Virology (Madison, WI)-poster
- 2009 49th Annual Meeting of the American Society for Cell Biology (San Diego, CA)-poster
- 2012 37th Annual Herpesvirus Workshop (Alberta, Canada)-poster
